2017考研英语二大作文范文
时间: 2018-07-05 11:24 作者:MPAcc考研网 来源:未知
【题目】
48.Directions:
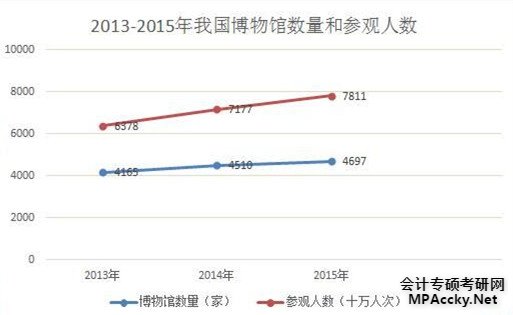
Write an essay based on the following chart. In your writing, you should
1) interpret the chart, and
2) give your comments.
You should wirte about 150 words on the ANSWER SHEET.(15 points)

【参考范文】
The statistics about museums and their visitors are precisely illustrated by the line chart. During the 3 years from 2013 to 2015, the figure of museums experienced a gradual rise, and soaring from 4.145 thousand to 4.692 thousand. Besides, following the same tendency, the number of museum visitors, as is shown, ascended gradually from 6.378 billion to 7.811 billion, increasing by about 1.43 billion.
The following factors, from my perspective, are responsible for the statistics. To begin with, aside from disseminating knowledge in schools, department concerned adopts other ways to promote the comprehensive quality of Chinese citizens, for instance providing more access to museums is a simple yet effective way to broaden visitors’ horizon. In addition, having been experiencing the unparalleled material prosperity, most of Chinese citizens intend to pursue knowledge by visiting museums, tourist attractions and other places. Moreover, museums, which are supported by public funding, provide visitors with knowledge and professional service. Individuals, therefore, are inclined to enjoy their leisure time by visiting museums.
To summarize, the data shown by the chart objectively reflect what’s happening in our society. Museums undoubtedly exert indispensable effects on our society and Chinese citizens, and it is predictable that, in the next decade, both large cities and small towns will witness the popularization of museums.
免责声明:本文内容均来源于网友提供或各大相关网站。由本站编辑整理,仅供个人研究、交流学习使用,不涉及商业盈利目的。
(责任编辑:联考网(liankao.net))
上一篇:2017考研英语二小作文范文

报考指南

- 北京国家会计学院会计 [db:description]…
复试录取

- 北京工商大学2018年全 2018年商学院会计专硕专业待录取名单(45人、另专项计划15人)各位考生: 北京工商大…

- 2019年MPAcc英语二大 1--25 句为首段描述数据 1. 就长度而言,中国的地铁笑傲群雄。--首段描述数据 As far …

- 2019年MPAcc英语二大 1--25 句为首段描述数据 1. 就长度而言,中国的地铁笑傲群雄。--首段描述数据 As far …
主办:联考网 商务合作邮箱:mpaccky#aliyun.com 请将#换成@
免责声明:本站所提供的内容均来源于网友提供或互联网搜集,由本站整理发布,仅供个人研究、交流学习使用,不涉及商业盈利目的。
特别感谢:MPAcc考研网
Copyright©2013 www.liankao.Net Inc. All Rights Reserved.中国联考网
鲁ICP备15026552号-4
免责声明:本站所提供的内容均来源于网友提供或互联网搜集,由本站整理发布,仅供个人研究、交流学习使用,不涉及商业盈利目的。
特别感谢:MPAcc考研网
Copyright©2013 www.liankao.Net Inc. All Rights Reserved.中国联考网
鲁ICP备15026552号-4
